Big Data, Small Data and Meaning

Victorian joke. From the Victorian Meme Machine, a BL Labs project (http://www.digitalvictorianist.com/)

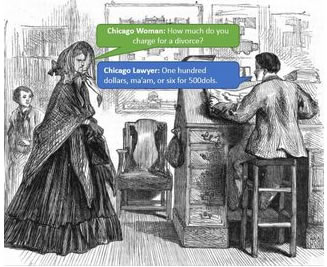
The BL Labs is an initiative funded by the Mellon Foundation that invites researchers and developers to work with the BL and their digital data to address research questions.  The Symposium 2014 showcased some of the work funded by the Labs, presenting innovative and exploratory projects that have been funded through this initiative. This year’s competition winners are  the Victorian Meme Machine, creating a database of Victorian jokes,  and a Text to Image Linking Tool (TILT) for linking areas on a page image and a clear transcription of the content.

Tim Hitchcock, Professor of Digital History from the University of Sussex, opened with a great keynote talk. He started out by stressing the role of libraries, archives and museums in preserving memory and their central place in a complex ecology of knowledge discovery, dissemination and reflection. He felt it was essential to remember this when we get too caught up in pursuing shiny new ideas.  It is important to continually rethink what it is to be an information professional; whilst also respecting the basic principles that a library (archive, museum) was created to serve.

Tim Hitchcock’s talk was Big Data, Small Data and Meaning. He said that conundrums of size mean there is a danger of a concentration on Big Data and a corresponding neglect of Small Data. But can we view and explore a world encompassing both the minuscule and the massive? Hitchcock introduced the concept of the macroscope, a term coined in a science fiction novel  by Piers Anthony back in 1970. He used this term in his talk to consider the idea of a macro view of data. How has the principle of the macroscope influenced the digital humanities? Hitchcock referred to Katy Borner’s work with Plug-and-Play Macroscopesa: “Macroscopes let us observe what is at once too great or too slow or too complex for the human eye and mind to notice and comprehend.” (See http://vimeo.com/33413091 for an introductory video).

Hitchcock felt that ideally macroscopes should be to observe patterns across large data and at the same time show the detail within small data.  The way that he talked about Big Data within the context of both the big and the small helped me to make more sense of Big Data methods. I think that within the archive community there has been something of a collective head scratching around Big Data;  what its significance is, and how it relates to what we do. In a way it helps to think of it alongside the analysis that Small Data allows researchers to undertake.

Graph from Paper Machines
Paper Machines visualisation (http://papermachines.org/)

Hitchcock gave some further examples of Big Data projects. Paper Machines is a plugin for Zotero that enables topic modelling analysis. It allows the user to curate a large collection of works and explore its characteristics with some great results; but the analysis does not really address detail.

The History Manifesto, by Jo Guldi and David Armitage talks about how Big Data might be used to redefine the role of Digital Humanities. But Hitchcock criticised it for dismissing micro-history as essentially irrelevant.

Scott Weingart is also a fan of the macroscope. He is a convincing advocate for network analysis, which he talks about in his blog, The modern role of DH in a data-driven world:

“distant reading occludes as much as it reveals, resulting in significant ethical breaches in our digital world. Network analysis and the humanities offers us a way out, a way to bridge personal stories with the big picture, and to bring a much-needed ethical eye to the modern world.”

Hitchcock posited that the large scale is often seen as a route to impact in policy formation, and this is an attractive inducement to think large. In working on a big data scale, Humanities can speak to power more convincingly; it can lead to a more powerful voice and more impact.

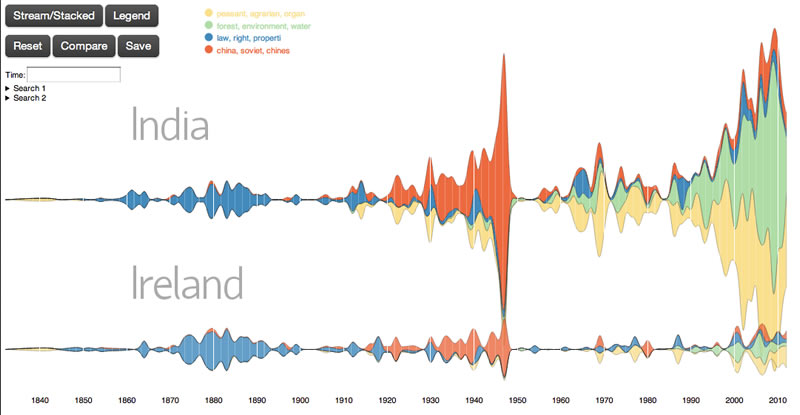
We were introduced to Ben Schmidt’s work, Prochronisms. This uses TV anachronisms to learn about changes in language scales of analysis around the analysis of text used, and Schmidt has done some work around particular TV programmes and films, looking at the overall use of language and the specifics of word use. One example of his work is the analysis of 12 Years a Slave:

visual representation of language in 12 Years a Slave
12 Years a Slave: Word Analysis (http://www.prochronism.com/)

‘the language Ridley introduces himself is full of dramatically modern words like “outcomes,” “cooperative,” and “internationally:” but that where he sticks to Northup’s own words, the film is giving us a good depiction of how things actually sounded. This is visible in the way that the orange ball is centered much higher than the blue one: higher translates to “more common than then now.”‘

Schmidt gives very entertaining examples of anachronisms, for example, the use of ‘parenting a child’ in the TV drama series Downton Abbey, which only shows up in literature 5 times during the 1920’s and in a rather different context to our modern use; his close reading of context also throws up surprises, such as his analysis of the use of the word ‘stuff’ in Downton Abbey (as in ‘family stuff’ or ‘general stuff’), which does not appear to be anachronistic and yet viewers feel that it is a modern term.  (A word of warning, the site is fascinating and it’s hard to stop reading it once you start!)

Professor Hitchcock gave this work as an example of using a macroscope effectively to combine the large and the small. Schmidt reveals narrative arcs; maybe showing us something that hasn’t been revealed before…and at the same time creates anxiety amongst script writers with his stark analysis!

Viewing data on a series of scales simultaneously seems a positive development, even with the pitfalls. But are humanists privileging social science types of analysis over more traditional humanist ones? Working with Big Data can be hugely productive and fun, and it can encourage collaboration, but are humanist scholars losing touch with what they traditionally do best? Language and art, cultural construction and human experience are complex things. Scholars therefore need to encompass close reading and Small Data in their work in order to get a nuanced reading.  Our urge towards the all-inclusive is largely irresistible, but in this fascination we may lose the detail. The global image needs to be balanced with a view from the other end of the macroscope.

It is important to represent and mobilise the powerless rather than always thinking about the relationship to the powerful; to analyse the construct of power rather than being held in the grip of power and technology. Histories of small things are often what gives voice to those who are marginalised. Humanists should encompass the peculiar and eccentric; they should not ignore the power of the particular.

Graph showing evidence for the Higgs boson particle
Graph showing evidence for the Higgs particle (http://www.atlas.ch/news/2012/latest-results-from-higgs-search.html)

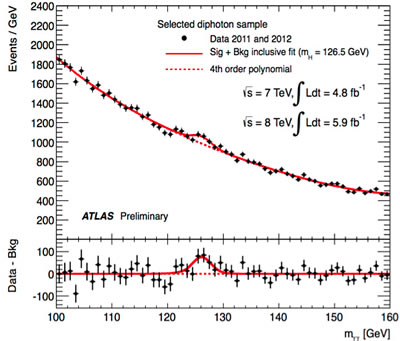
Of course, Big Data can have huge and fundamental results. The discovery of the Higgs particle was the result of massive data crunching and finding a small ‘bump’ in the data that gave evidence to support its existence. The other smaller data variations needed to be ignored in this scenario. It was a case of millions of rolls of the dice to discover the elusive particle. But if this approach is applied across the board, the assumption is that the signal, or the evidence, will come through, despite the extraneous blips and bumps. It doesn’t matter if you are using dirty data because small hiccups are just ignored.  But humanists need to read data with an eye to peculiarities and they should consider the value of digital tools that allow them to think small.

Hitchcock believes that to perform humanities effectively we need to contextualise.  And the importance of context is never lost to an archivist, as this is a cornerstone of our work. Big Data analysis can lose this context; Small Data is all about understanding context to derive meaning.

Using the example of voice onset timing, which refers to the tiny breathy gap before speaking, Hitchcock showed that a couple of milliseconds of empty space can demand close reading, because it actually changes depending on who you are talking to, and it reveals some really interesting findings. A Big Data approach would simply miss this fascinating detail.

Big data has its advantages, but it can mean that you don’t look really closely at the data set itself. There is a danger you present your results in a compelling graph or visualisation, but it is hard to see whether it is a flawed reality. You may understand the whole thing, and you can draw valuable conclusions, but you don’t take note of what the single line can tell you.

Big Data: what’s it all about?

This blog is about ‘Big Data’. I think it’s worth understanding what’s happening within this space, and my aim is to give a (reasonably) short introduction to the concept and  possible relevance for archives.

I attended the the Eduserv Symposium 2012 on Big Data , and this post is partly inspired by what I heard there, in particular the opening talk by Rob Anderson, Chief Technology Officer EMEA. Thanks also to Adrian Stevenson and Lukas Koster for their input during our discussions of this topic (over a beer!).

ServersWhat is Big Data? In the book Planning for Big Data (Edd Dumbill, O’Reilly) it is described as:

data that exceeds the processing capacity of conventional database systems. The data is too big, moves too fast, or doesn’t fit the strictures of your database architectures. To gain value from this data you must choose an alternative way to process it.”

Big data is often associated with the massive and growing scale of data, and at the Eduserv Symposium many speakers emphasised just how big this increase in data is (which got somewhat repetitive). Many of them spoke about projects that involve huge, huge amounts of data, in particular medical and scientific data. For me tera- and peta- and whatever else -bytes don’t actually mean much. Suffice to say that this scale of data is way way beyond the sort of scale of data that I normally think about in terms of archives and archive descriptions.

We currently have more data than we can analyse, and  90% of the digital universe is unstructured, a fact that drives the move towards the big data approach. You may think big data is new; you may not have come across it before, but it has certainly arrived. Social media, electronic payments, retail analytics, video analysis of customers, medical imaging, utilities data, etc, etc., all are in the Big Data space, and the big players are there too – Google, Amazon, Walmart, Tesco, Facebook, etc., etc., – they all stand to gain a great deal from increasingly effective data analysis.

Very large scale unstructured data needs a different approach to structured data. With structured data there is a reasonable degree of routine. Data searches of a relational database, for example, are based around the principle of searching specific fields, the scope is already set out. But unstructured data is different, and requires a certain amount of experimentation with analysis.

The speakers throughout the Eduserv symposium emphasised many of the benefits that can come with the analysis of unstructured data. For example, Rob Anderson argued that we can raise the quality of patient care through analysis of various data sources – we can take into account treatments, social and economic factors, international perspective

, individual patient history. Another example he gave was the financial collapse: could we have averted this at least to some extent through being able to identify ‘at risk’ customers more effectively? It certainly seems convincing that analysing and understanding data more thoroughly could help us to improve public services and achieve big savings. In other words, data science principles could really bring public benefits and value for money.

Venn diagram for big data
The characteristics of big data

But the definition of big data as unstructured data is only part of the story. It is often characterised by three things, volume (scale), velocity (speed) and variety (heterogenous data).

It is reasonably easy to grasp the idea of volume – processing huge quantities of data. For this scale of data the traditional approaches, based on structured data, are often inadequate.

Velocity may relate to how quickly the data comes into the data centre and the speed of response. Real-time analysis is becoming increasingly effective, used by players like Google. It enables them to instantly identify and track trends – they are able to extract value from the data they are gathering. Similarly Facebook and Twitter are storing every message and monitoring every market trend. Amazon react instantly to purchase information – this can immediately affect price and they can adjust the supply chain. Tesco, for example, know when more of something is selling intensively and can divert supplies to meet demand. Big data approaches are undoubtedly providing great efficiencies for companies, although it raises the whole question of what these companies know about us and whether we are aware of how much data we are giving away.

The variety of data refers to diversity, maybe data from a variety of sources. It may be un-curated, have no schema, be inconsistent and changing. With these problems it can be hard to extract value. The question is, what is the potential value that can be extracted and how can that value be used to good effect? It may be that big data leads to the opti

mised organisation, but it takes time and skill to build what is required and it is important to have a clear idea of what you are wanting to achieve – what your value proposition is. Right now decisions are often made based on pretty poor information, and so they are often pretty poor decisions. Good data is often hard to get, so decisions may be based on little or no data at all. Many companies fail to detect shifts in consumer demand, but at the same time the Internet has made customers more segmented, so the picture is more complex. Companies need to adjust to this and respond to differing requirements. They need to take a more scientific approach because sophisticated analytics makes for better decisions and in the end better products.

Eduserv Symposium
Andy Powell introduces the Eduserv Symposium: Big Data, big deal?

At the Eduserv Symposium there were a number of speakers who provided some inspirational examples of what is possible with big data solutions. Dr Guy Coates from the Wellcome Trust Sanger Institute talked about the human genome. The ability to compare, correlate with other records and work towards finding genetic causes for diseases opens up exciting new opportunities. It is possible to work towards more personalised medicine, avoiding the time spent trying to work out which drugs work for individuals. Dr Coates talked about the rise of more agile systems, able to cope with this way of working, more modular design and an evolving incremental approach rather than the typical  3-year cycle of complete replacement of hardware.

Professor Anthony Brookes from the University of Leicester introduced the concept of ‘knowledge engineering’, thinking about this in the context of health. He stated that in many cases it may be that the rate of data generation is increasing, but it is often the same sort of data, so it may be that scale is not such an issue in all cases. This is an important point. It is easy to equate big data with scale, but it is not all about scale. The rise of Big Data is just as concerned with things like new tools that are making analysis of data more effective.

Prof Brookes described knowledge engineering as a discipline that involves integrating knowledge into computer systems in order to solve complex problems (see the i4health website for more information). He effectively conveyed how we have so much medical knowledge, but the knowledge is simply not used properly. Research and healthcare are separate – the data does not flow properly between them. We need to bring together bio-informatics and academics with medical informatics and companies, but at the moment there is a very definite gap, and this is a really really big problem. We need to build a bridge between the two, and for this you need an engineer – a knowledge engineer – someone with expertise to work through the issues involved in bridging the gap and getting the data flow right. The knowledge engineer needs to understand the knowledge potential, understand standards, understand who owns the data, understand the ethics, think about what is required to share data, such as having researcher IDs, open data discovery, remote pooled analysis of data, categories of risk for data. This type of role is essential in order to effect an integration of data with knowledge.

As well as hearing about the knowledge engineer we heard about the rise of the ‘data scientist‘, or, rather more facetiously, the “business analyst who lives in Califorina” (Adam Cooper’s blog). This concept of a data scientist was revisited throughout the Eduserv symposium. At one point it was referred to as “someone who likes telling stories around data”, an idea that immediately piqued my interest. It did seem to be a broad concept, encompassing both data analysis and data curation, although in reality these roles are really quite distinct, and there was acknowledgement that they need to be more clearly defined.

Big data has helped to create an atmosphere where expectations people have of the public sector are no longer met; expectations created by what is often provided in the private sector, for example, a more rapid response to enquiry. We expect the commercial sector to know about us and understand what we want and maybe we think public services should do the same?  But organisational change is a big challenge in the public sector. Data analysis can actually be seen as opposed to the ‘human agenda’ as it moves away from the principle of  human relationships. But data can drive public service innovation, and help to allocate resources efficiently, in a way that responds to need.

Big Data raises the question of the benefits of open, transparent and shared information. This message seems to come to the fore again and again, not just with Big Data, but with the whole open data agenda and Linked Data area. For example, advance warning for earthquakes requires real-time analytics – it is hard to extract this information from the diverse systems that are out there. But a Twitter-based Earthquake Detector provides substantial benefits. Simply by following #quake tweets it is possible to get a surprisingly accurate picture very quickly; apparently more #quake tweets has been shown to be an accurate indication of a bigger quake. Twitter users reacted extremely quickly to the quake and tsunami in Japan. In the US, the Government launched a cash for old cars initiative (Cash for Clunkers), to encourage people to move to greener vehicles. The Government were not sure whether the initiative was proving to be successful, but Google knew that it was, because they had the information about what people were searching for and they could see people searching for this initiative to find information about what the Government were offering. Google can instantly find out where in the world people are searching for information – for example, information about flu trends, because they can analyse which search terms are relevant, something called ‘nowcasting‘.

In the commercial sector big data is having a big impact, but it is less certain what its impact is within higher education and sectors such as cultural heritage. The question many people seem to be asking is  ‘how will this be relevant to us?’

Big data may have implications for archivists in terms of what to keep and what to delete. We often log everything because we don’t know what questions we will want the answer to. But if we decide we can’t keep everything then what do we delete? We know that people only tend to criticise if you get it wrong. In the US the new National Science Foundation data retention requirements now mean you have to keep all data for 3 years after the research award conclusion, and you must produce a data management plan. But with more and more sophisticated means of processing data, should we be looking to keep data that we might otherwise dispose of? We might have considered it expensive to manage and hard to extract value from, but this is now changing. Should we always keep everything when we can? Many companies are simply storing more and more data ‘just in case’; partly because they don’t want to risk being accused of throwing it away if it turns out to be important. Our ideas of what we can extract from data are changing, and this may have implications for its value.

Does the archive community need to engage with big data? At the Eduserv Symposium one of the speakers referred to NARA making available documents for analysis. The analysis of data is something that should interest us:

“A common use of big data processing is to take unstructured data and extract ordered meaning, for consumption either by humans or as a structured input to an application.” (Planning for Big Data, Edd Dumbill).

For example, you might be looking to determine exactly what a name refers to: is this city London, England or London, Texas? Tasks such as crowd-sourcing, cleaning data, answering imprecise questions, these are relevant in the big data space and therefore potentially relevant within archives.

As already stated, it is about more than scale, and it can be very relevant to the end-user experience: “Big data is often about fast results, rather than simply crunching a large amount of information.” (Dumbill) For example, the ability to suggest on-the-fly which books someone might enjoy requires a system to provide an answer in the time it takes a page to load. It is possible to think about ways that this type of data processing could enhance the user experience within the archives space; helping the user to find what might be of relevance to their research. Again, expectations may start to demand that we provide this type of experience, as many other information sites already provide it.

The Eduserv Symposium concluded that there is a skills gap in both the public and commercial sector when it comes to big data. We need a new generation of “big data scientists” to meet a need. We also need to combine algorithms, machines and people holistically to meet the big data problem. There may be an issue around mindset, particularly in terms of worries about the use of data – something that arises in the whole open data agenda. In addition, one of the big problems we have at the moment is that we are often building on infrastructures that are not really suited to this type of unstructured data. It takes time, and knowledge of what is required, to move towards a new infrastructure, and the advance of big data may be held back by the organisational change required and skills needed to do this work.